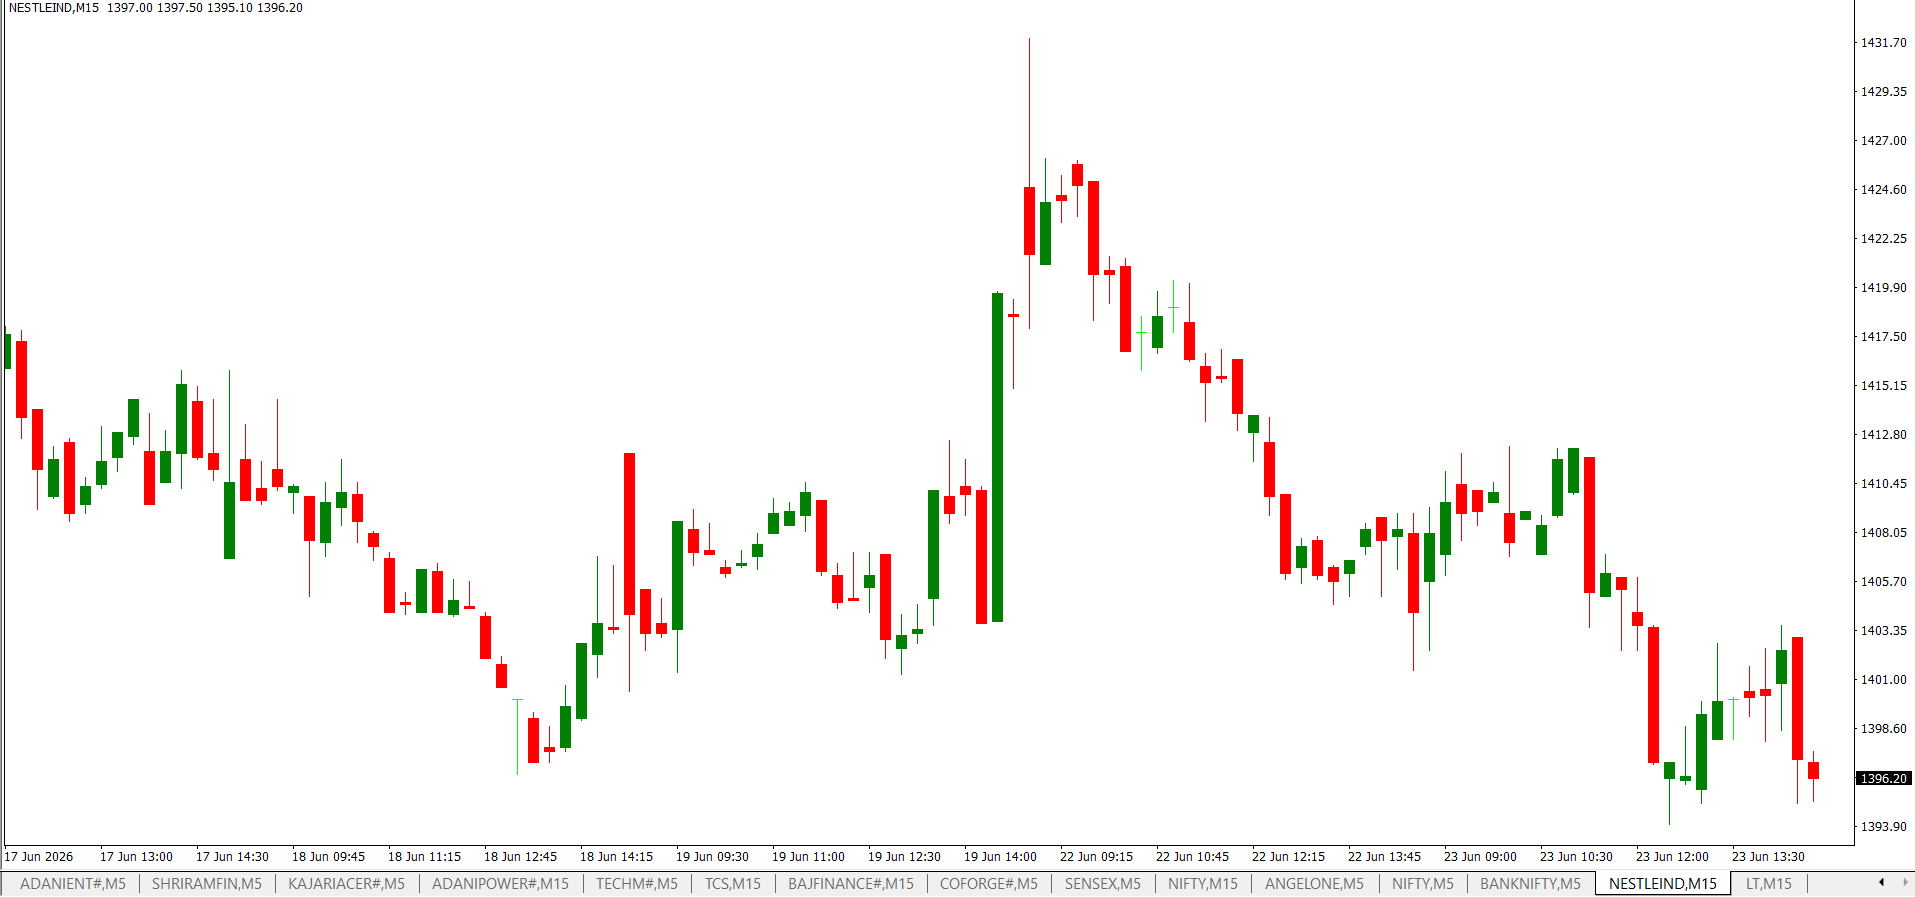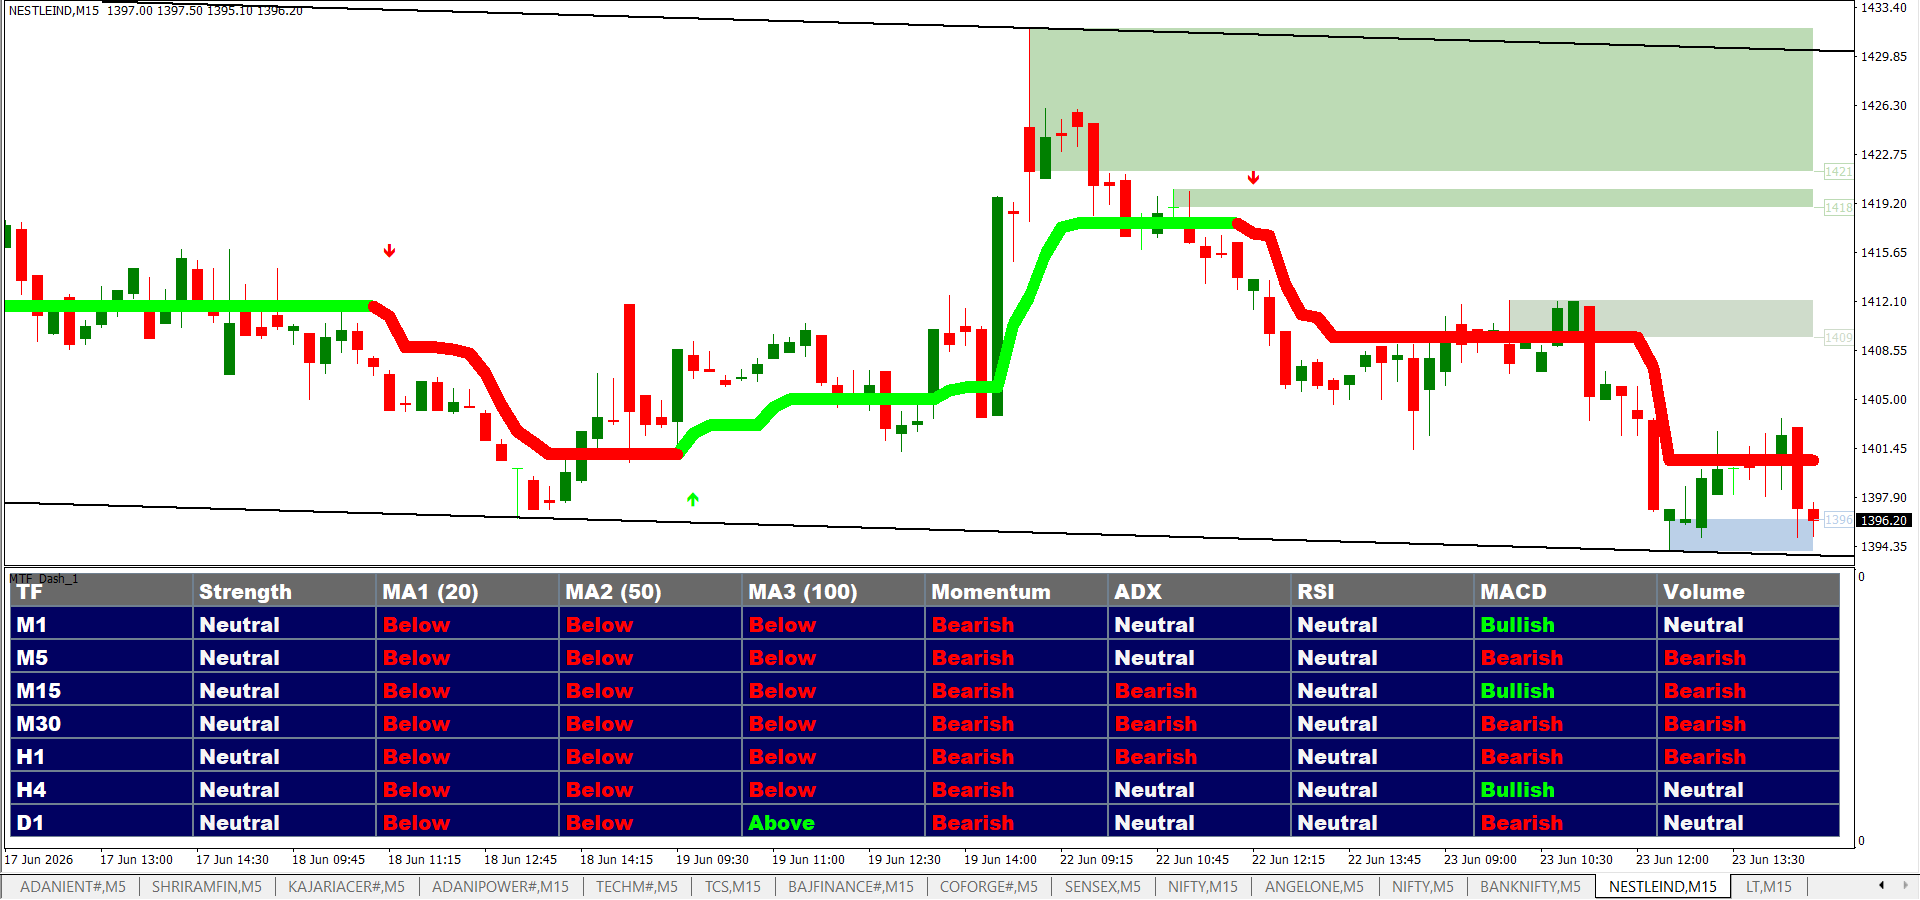
The only software you need for all technical analysis for your day trading and scalping needs.
Our software is designed to remove the biggest headache for traders — manual technical analysis. Whether you are a day trader, swing trader, or long-term investor, our system makes technical analysis simple and precise.
Buy NowMaking trading journey easy
Missing Winning Trades Because
Your Analysis Takes Too Long?
Manual technical analysis is slow, inconsistent, and emotionally exhausting. By the time you confirm your setup, the opportunity is often gone. Our software analyzes the market in seconds and gets you clear, actionable trading analysis.
Why Choose Glory Charts
as your trading companion?
Multi Timeframe Technical Indicator Dashboard
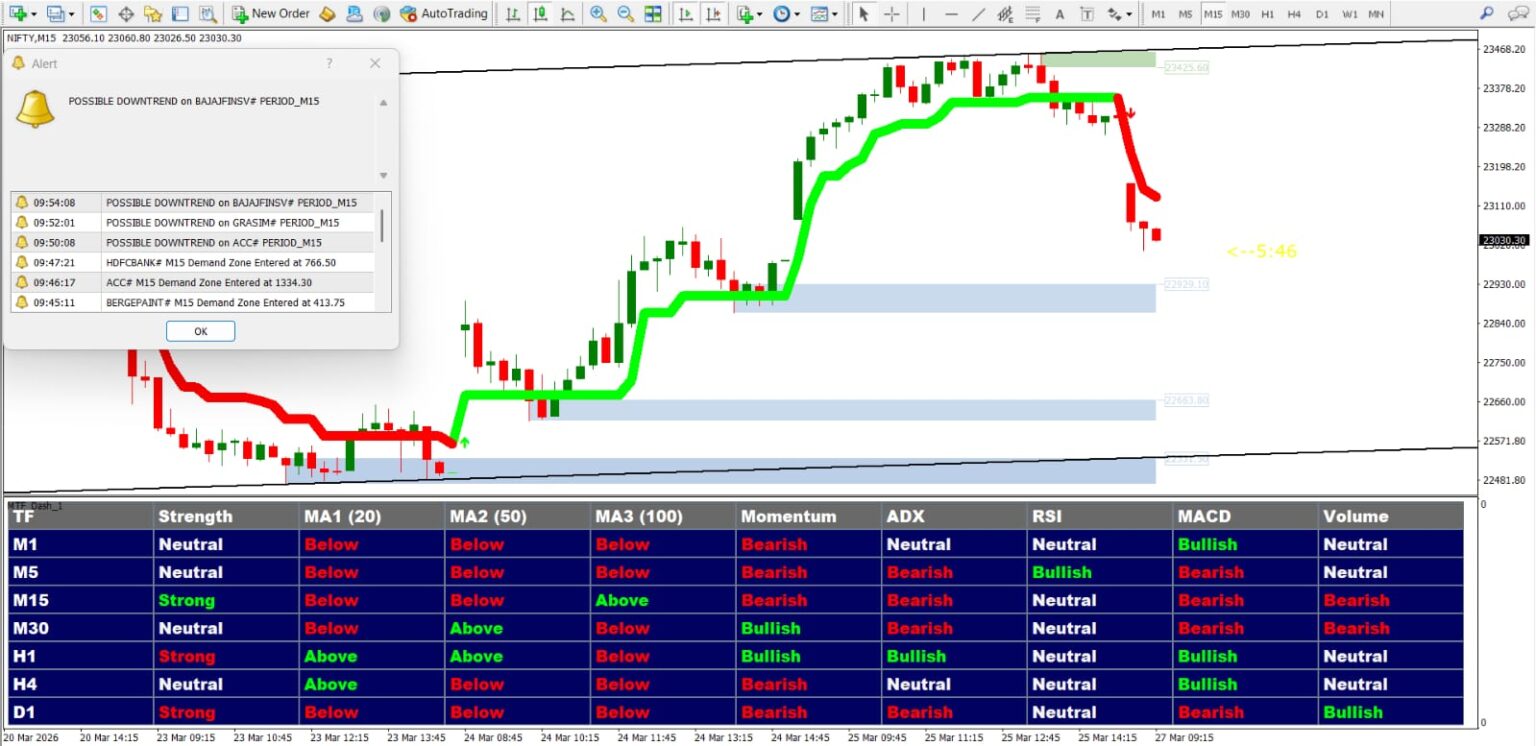
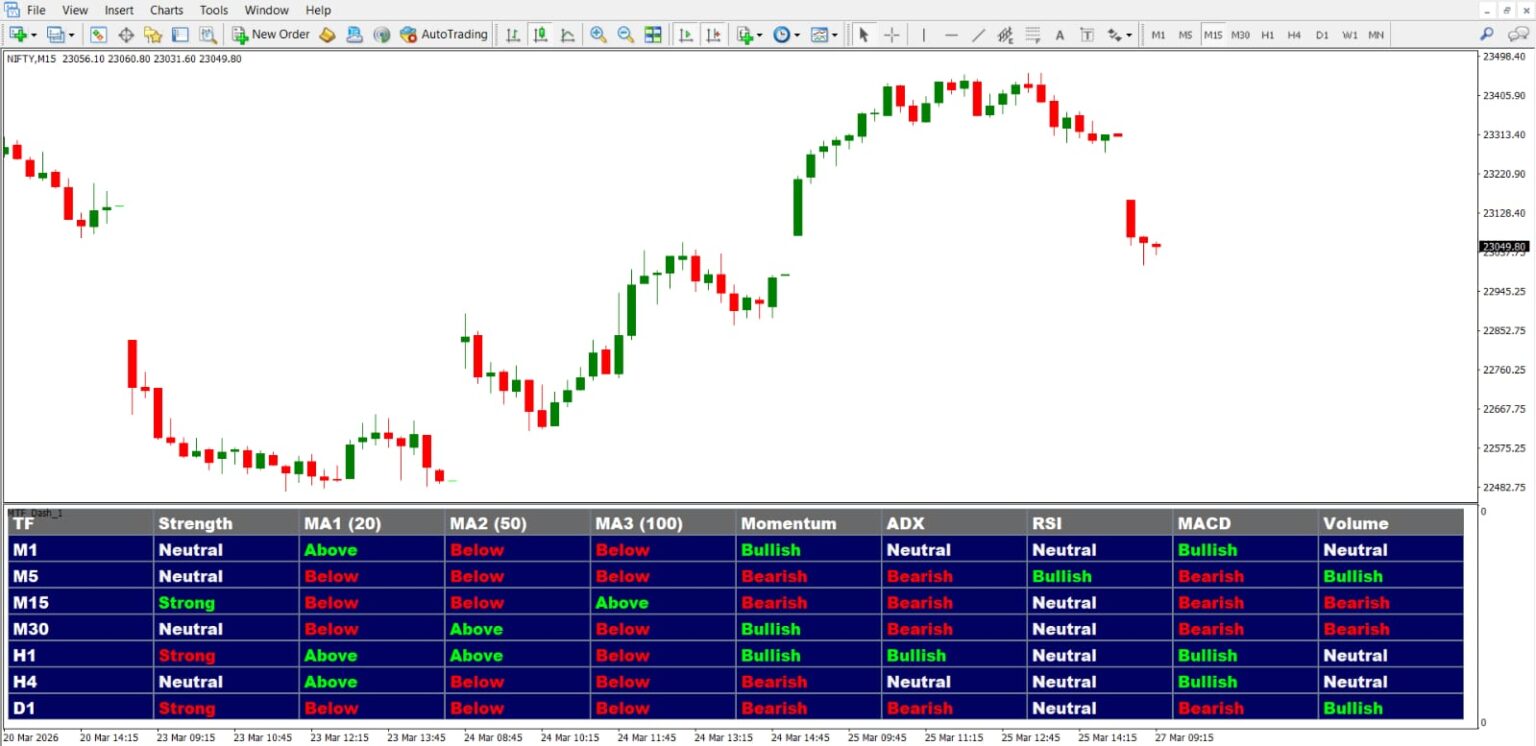
Multi Timeframe Technical Analysis Dashboard shows key market indicators across different timeframes in one simple view.It includes trend strength, moving averages, momentum, ADX, RSI, MACD, and volume.Clear labels like bullish, bearish, or neutral make it easy to read.Helps traders quickly understand the overall market direction and make better decisions.
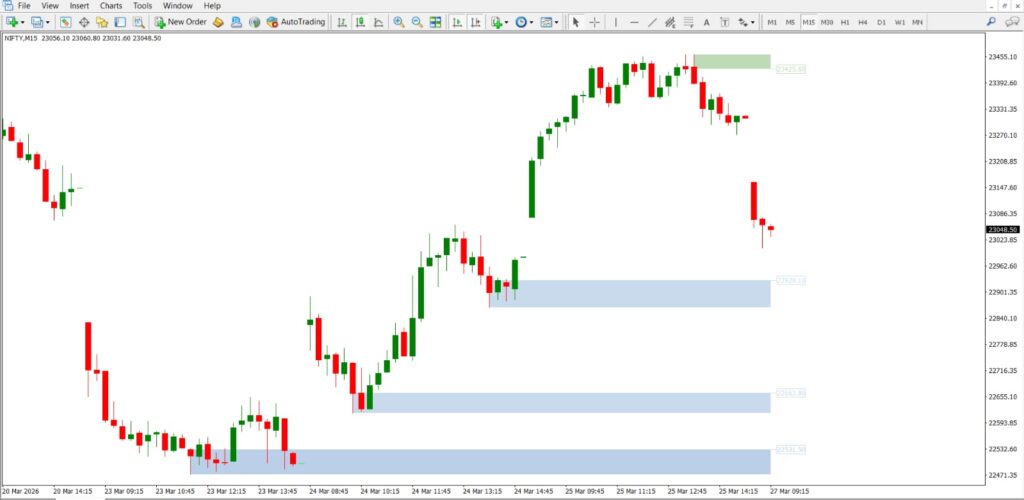
Automatically Draws Trend Lines, Support and resistance lines
Glory Charts Software takes the hassle out of technical analysis by automatically detecting and displaying key support and resistance levels on your charts.
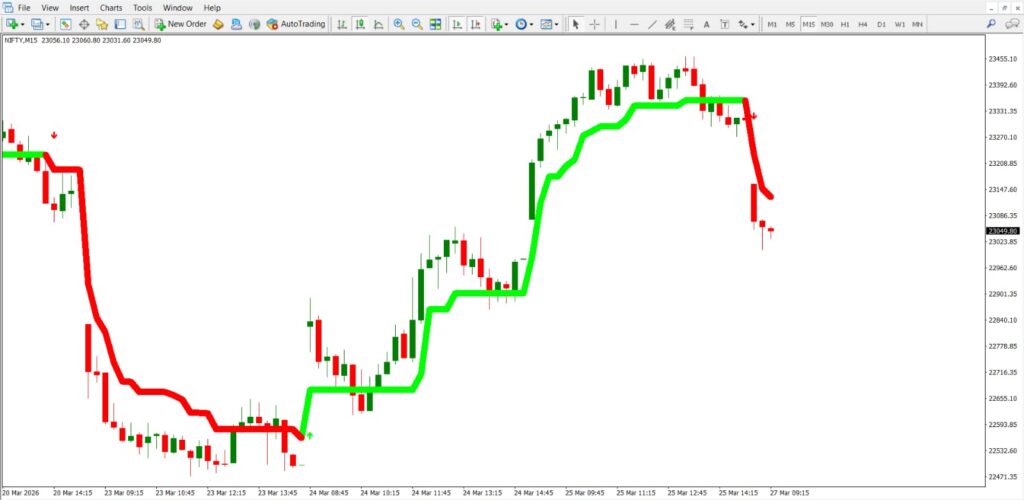
Dynamic Trend Indicator
Our intelligent SuperTrend indicator dynamically shifts between green and red to highlight bullish or bearish trends, helping traders easily identify ideal entry, exit, and stop-loss points with precision.
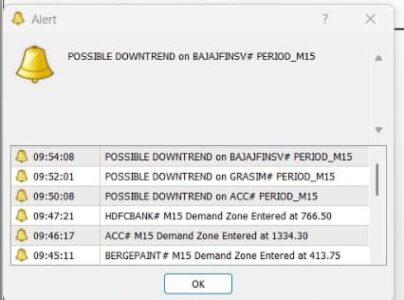
Automatic Pop-up Alerts
You’ll also receive real-time popup alerts whenever price approaches the important zones or dynamic trend indicator changes trend on any open chart, ensuring you never miss a potential trade setup. This feature helps you to trade smarter.
Multiple timeframes Supported
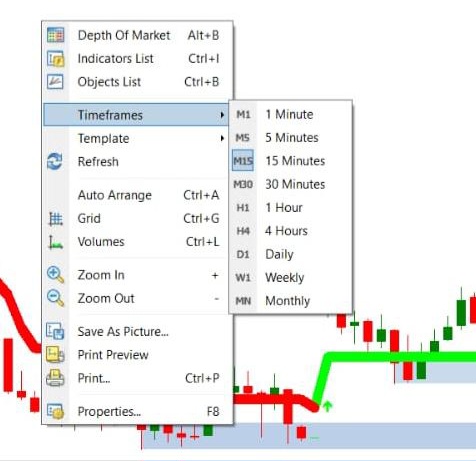
Glory Charts supports multiple timeframes, allowing traders to analyze markets from minute charts to weekly trends. Gain a complete market perspective, align short-term trades with long-term trends, and make smarter decisions.
Real-time Charts for All indexes & 500+ Stocks
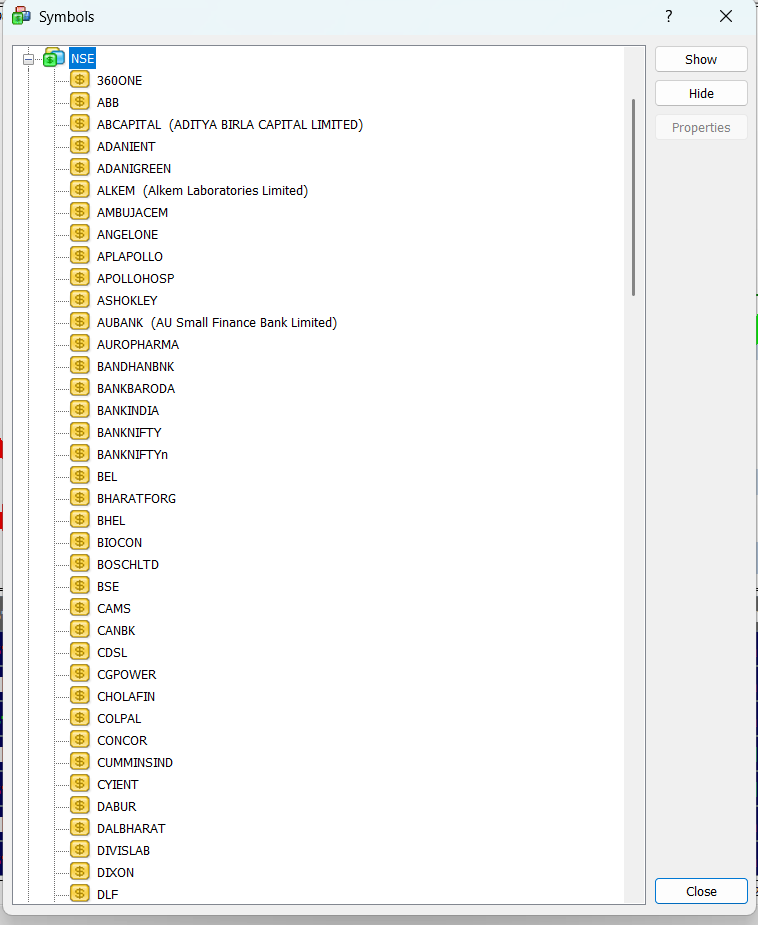
Our platform supports all F&O and 500+ NSE cash stocks, including major indexes like Nifty, Bank Nifty, and more — ensuring complete market coverage for every trader.
Transform Your Chart into an Advanced, Insightful Trading Dashboard — Instantly with One Click